islands dataset sort and find largest and snalest
R Studio Applied statistics using R problems Sample Codes

Access Data Set Islands and Find Largest and Smallest Masses

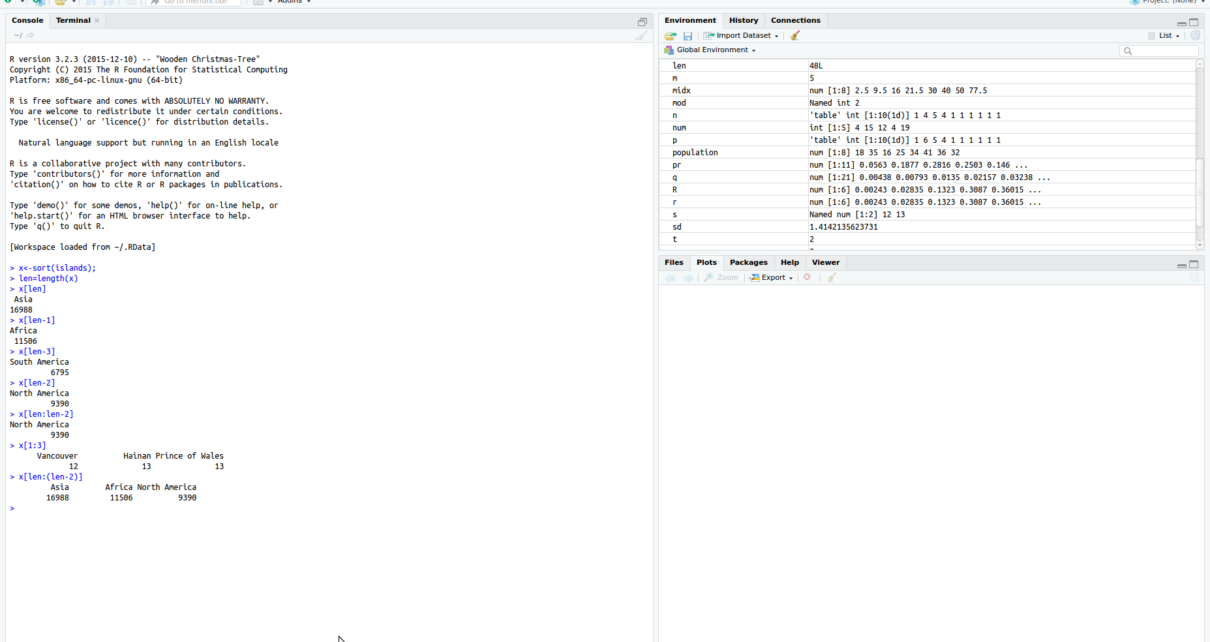
Access the data set Islands from the base package of R. Use suitable R command to find 3 largest masses and 3 smallest masses from the data set. Solution:- > x<-sort(islands); > len=length(x) > x[1:3] Vancouver Hainan Prince of Wales 12 13 13 > x[len:(len-2)] Asia Africa North America 16988 11506 9390 Sort the data […]

Plot examples using DDT dataset
R Studio Applied statistics using R problems Sample Codes

Read the Builtin Data Set DDT from Library Mass and Perform hist() & boxplot()

The data set DDT in the library MASS contain independent measurements of the pesticides DDT. Access the data set and make a histogram and box plot of the diagram. Solution > x<-DDT > x; [1] 2.79 2.93 3.22 3.78 3.22 3.38 3.18 3.33 3.34 3.06 3.07 3.56 3.08 4.64 3.34 > hist(x); > boxplot(x); OUTPUT […]

survey of age plot using R Studio
Applied statistics using R problems

Read Data Set and Apply Plot(), Hist(), Boxplot() Using R

Prepare a table using the data set survey of age and draw the corresponding diagram, Histogram and box plot (Apply hist(), plot(), boxplot()). Solution:- we can do this problem using combine(c) function or scan function in R. c() combines a set of data and scan() read the elements in run time. Using C() survey_of_age<-c(23,23,24,23,25,21,20,23,25,25,24,21); plot(survey_of_age); […]

find mean median mode using R
Applied statistics using R problems R Studio Sample Codes

Find Mean Median and Mode of Data Set Using R

20 Students Graduates and under graduates were enrolled in a maths course. Their ages were 18, 19, 19, 19, 19,20,20,20,20,20,21,21,21,21,22,23,24,27,30,36 Find the median age of all students. Find the median age of all students under 25 years Find the mode age of all students Find the mean age of all students Two more students enter […]