
- Prepare a table using the data set survey of age and draw the corresponding diagram, Histogram and box plot (Apply hist(), plot(), boxplot()).
Solution:-
we can do this problem using combine(c) function or scan function in R.
c() combines a set of data and scan() read the elements in run time.
Using C()
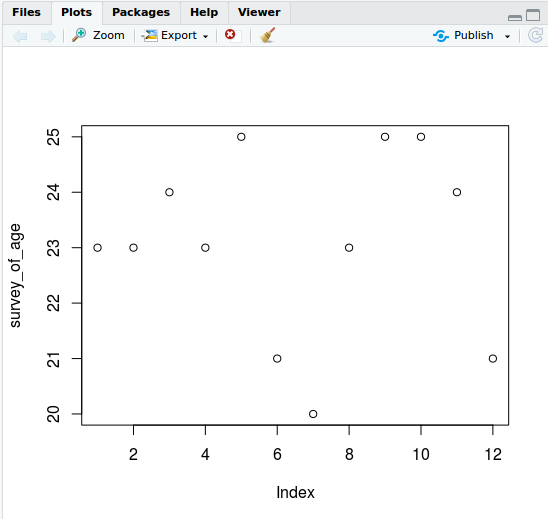
survey_of_age<-c(23,23,24,23,25,21,20,23,25,25,24,21);
plot(survey_of_age);

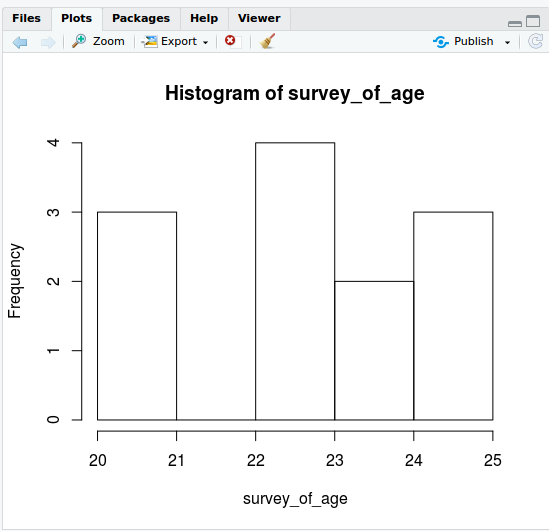
hist(survey_of_age)
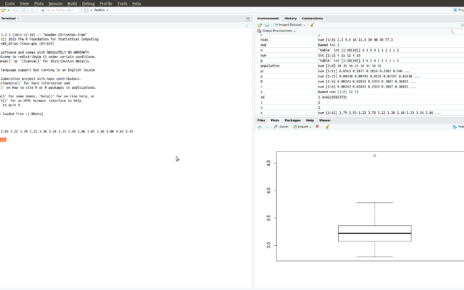
boxplot(survey_of_age)

Using scan()
> survey_of_age<-scan()
1: 12
2: 12
3: 15
4: 15
5: 15
6: 16
7: 13
8: 13
9: 17
10: 18
11:
Read 10 items
and perform hist(), plot() and boxplot() in that data.

One Reply to “Read Data Set and Apply Plot(), Hist(), Boxplot() Using R”