
The data set DDT in the library MASS contain independent measurements of the pesticides DDT. Access the data set and make a histogram and box plot of the diagram.
Solution
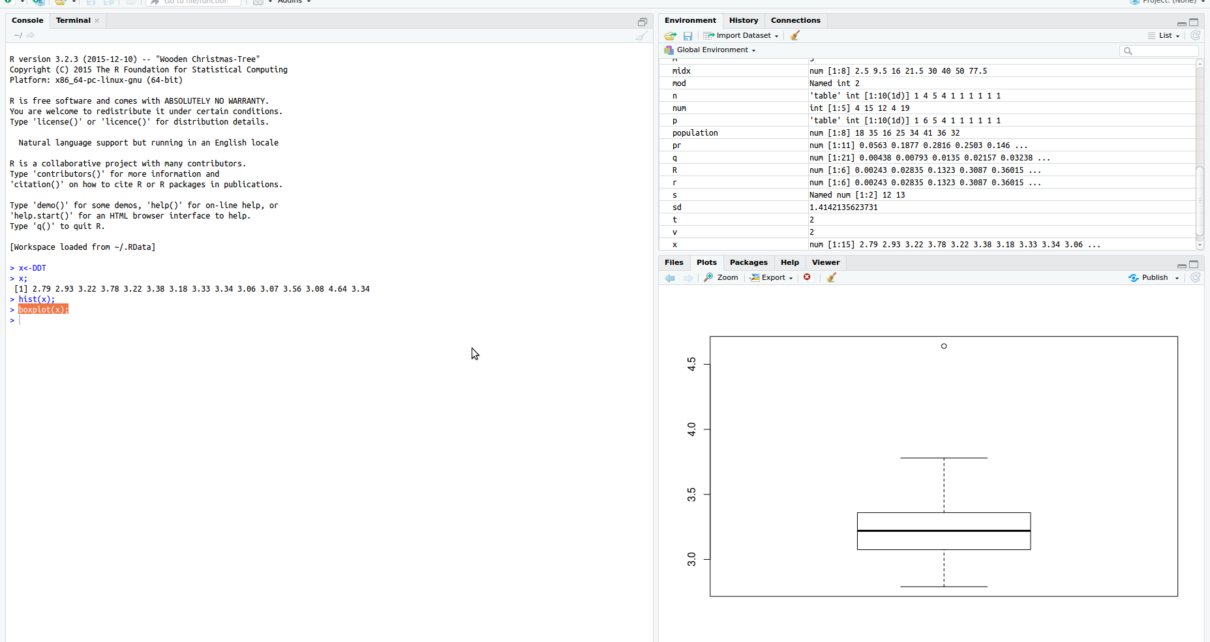
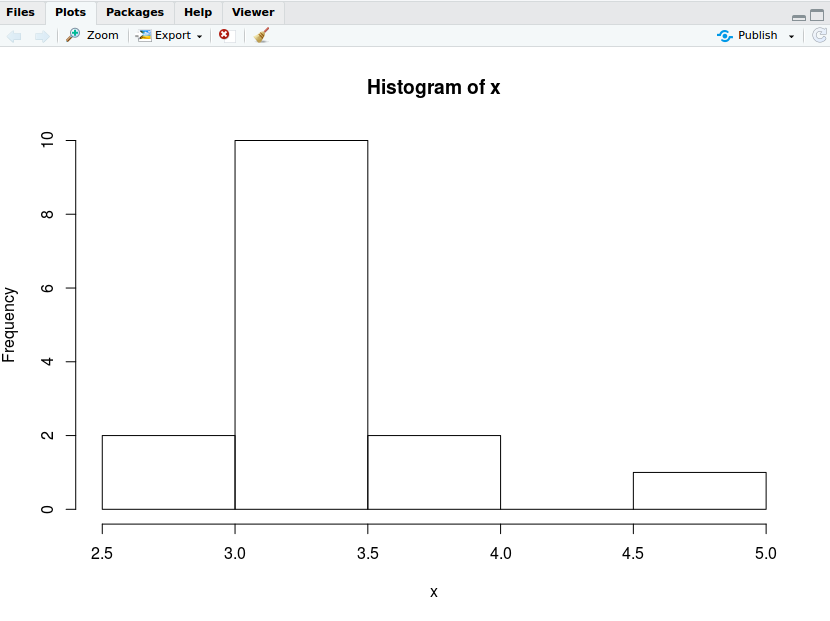
> x<-DDT
> x;
 [1] 2.79 2.93 3.22 3.78 3.22 3.38 3.18 3.33 3.34 3.06 3.07 3.56 3.08 4.64 3.34
> hist(x);
> boxplot(x);
OUTPUT
hist(x):
boxplot()

Screenshot of RStudio


One Reply to “Read the Builtin Data Set DDT from Library Mass and Perform hist() & boxplot()”